My medicine chief used to talk about how there are 3 kinds of doctors who perform lab investigations.
An investigation is like a light pole. There is the first category that uses the light pole to shine a light on their diagnosis. They do lab investigations to confirm their clinical diagnosis. The second category is the people who lean on the pole. They do lab investigations hoping that something or the other will turn out positive. And then there is the third category. They use investigations as if a street dog uses the light pole.
He used to raise one leg and ask the interns,
Tell me, what does a street dog do to the pole? Yup, the dog urinates on the pole. The third category sends the patient for all sorts of investigations possible with no clinical rationale.
Every challenging bug that we solve in tech also involves some investigation - research, finding patterns from logs, system vitals, and backtraces of errors, and isolating the offending line number. It is easy to end up in a wild goose chase if one is unsystematic when solving a bug.
We recently faced the challenge of diagnosing a high memory usage of our application servers. Thanks to Neeraj, for pushing us to follow the evidence. Finding the root cause of the issue took us a few days of investigation.
Symptoms
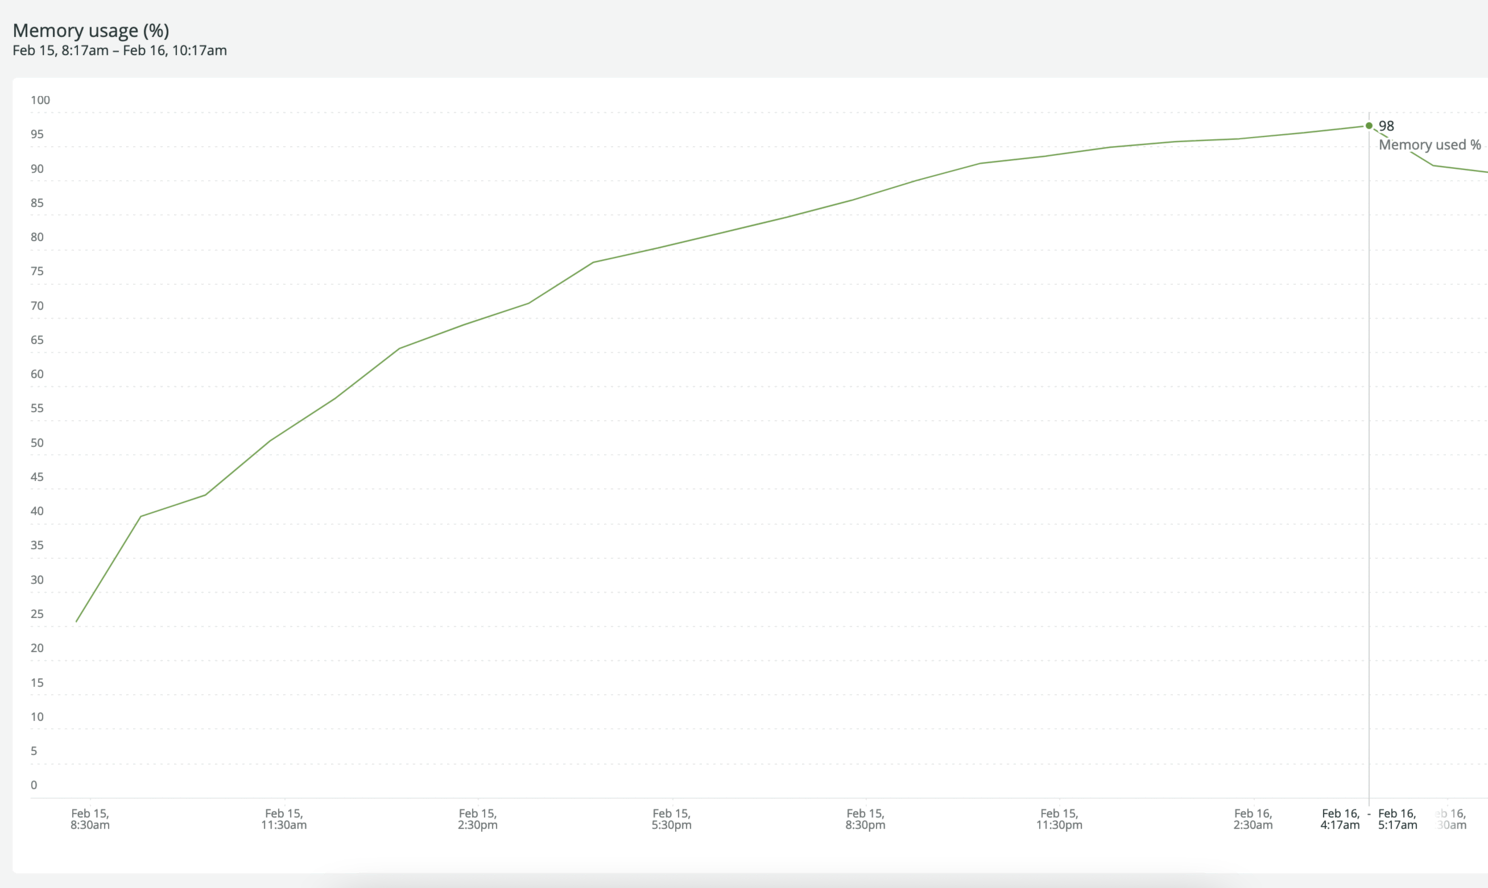
At Avegen, we deploy our platform to multiple data centres and servers. A few months ago, we started facing trouble on our web application servers. The memory usage of our application kept growing after a service restart. The application then ate up all the system memory increasing response times and degrading the user experience.
Investigations and research
Before we started investigating the root cause, the first action we took was to relieve the end-users from facing any trouble. Do you remember what the 90’s support engineers asked everyone? “Did you try rebooting?“. We did the same! Our application servers run behind an application load balancer. Every 2 hours, we took one of the nodes out of traffic, restarted the application, and put them back into service.
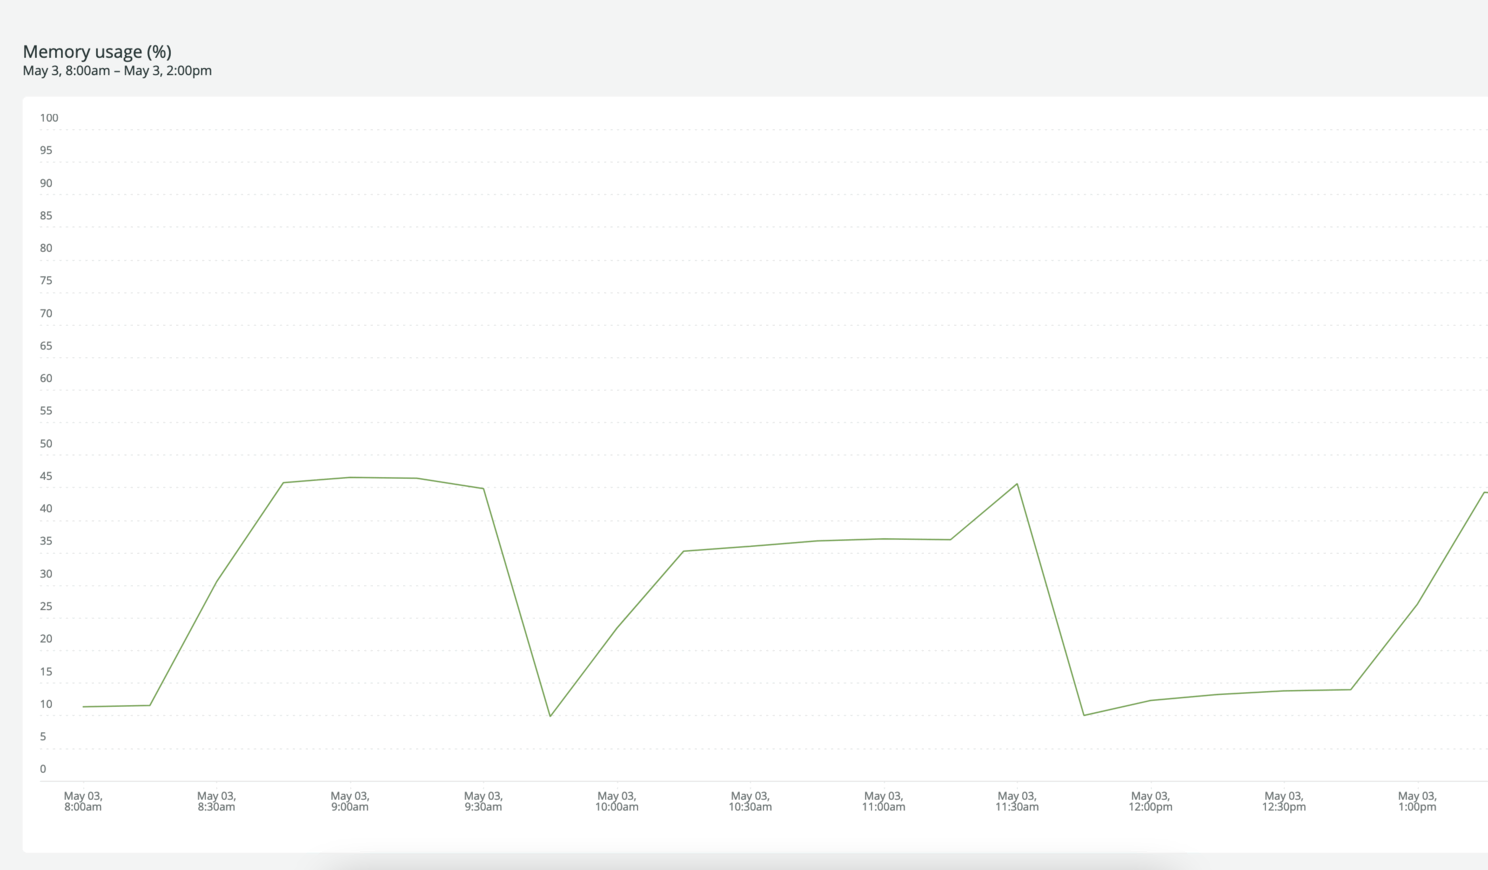
This gave us a band-aid fix while we investigated the root cause.
In the last few days, we learned about Ruby memory allocation, changed the memory allocator of Ruby to jemalloc, tracked open file descriptors, but to no avail. The memory usage pattern remained the same.
Signs and Diagnosis
Follow the breadcrumbs
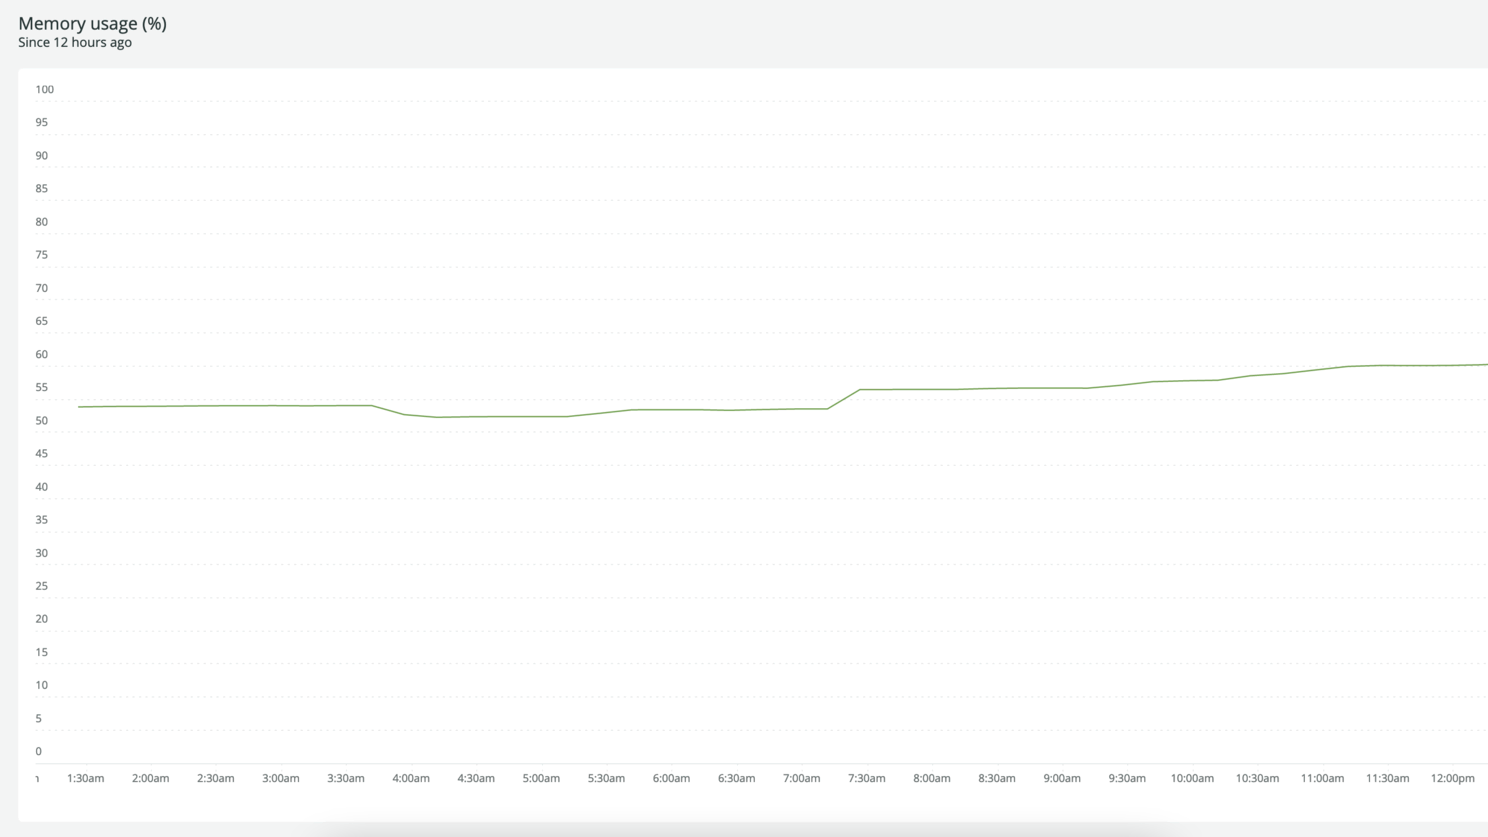
We checked the patterns from the graphs and identified pieces of evidence.
- The growing memory had a step pattern.
- The step increase was always associated with a network spike and CPU usage spike.
- The background job services were not affected.
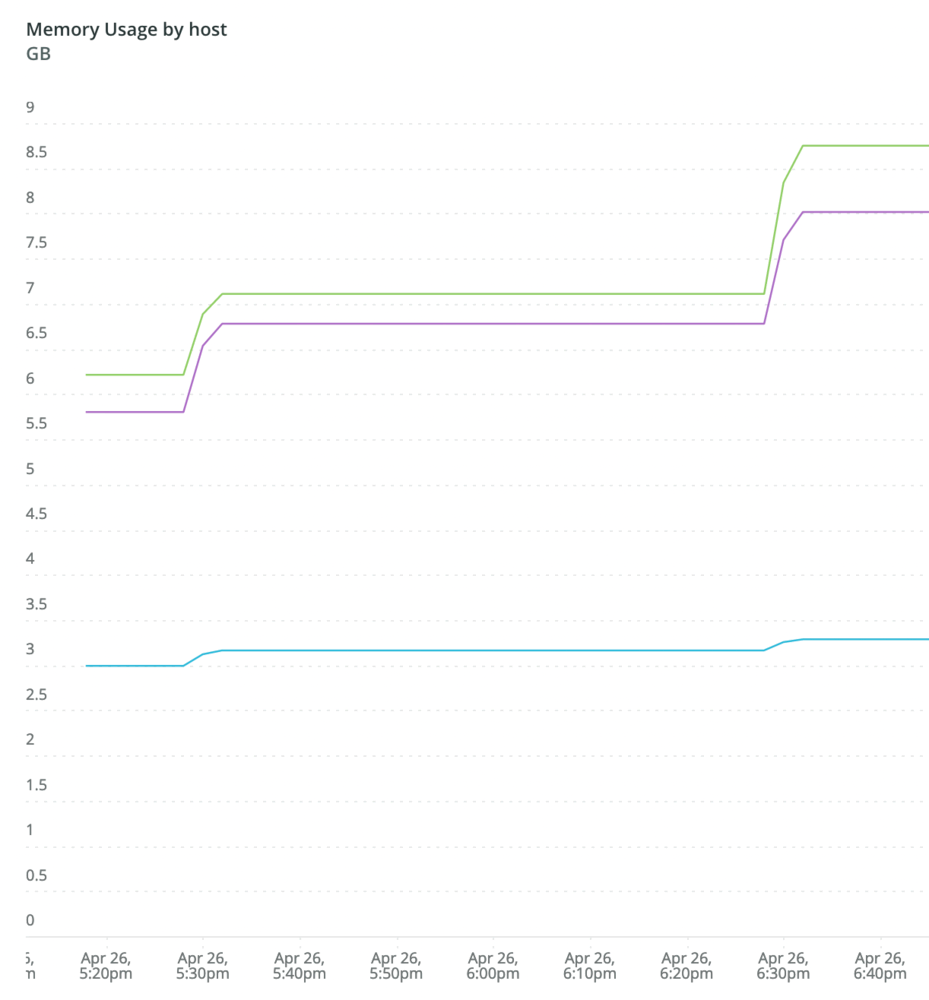
The next step was to identify similar instances of step patterns and we found many such. What happens during this time frame? Obviously, the answer was in the logs. We were able to find one offending request which was common in all such instances.
Offending API call - Completed 200 OK in 15310ms (Views: 0.7ms | ActiveRecord: 529.2ms | Allocations: 23453546)
vs
Regular API call - Completed 200 OK in 949ms (Views: 85.2ms | ActiveRecord: 845.9ms | Allocations: 12677)
The memory allocations in the offending request were massive. And every such request increased the memory usage of the application by a step. To our surprise, the offending API involved our translation framework.
Zeroing in on the suspect
Our healthcare platform is deployed to 14+ countries and various languages. We have an in-house translation framework that internationalizes the platform. A change in the translation resulted in the cache clear followed by the first request doing the following.
- Fetching translations from the database
- And rebuilding the translation cache
These findings fell in place with the evidence we had. The network spike was the database query result and the rebuilding of the cache with objects allocated in Rails resulted in growing memory.
Catching the suspect red-handed
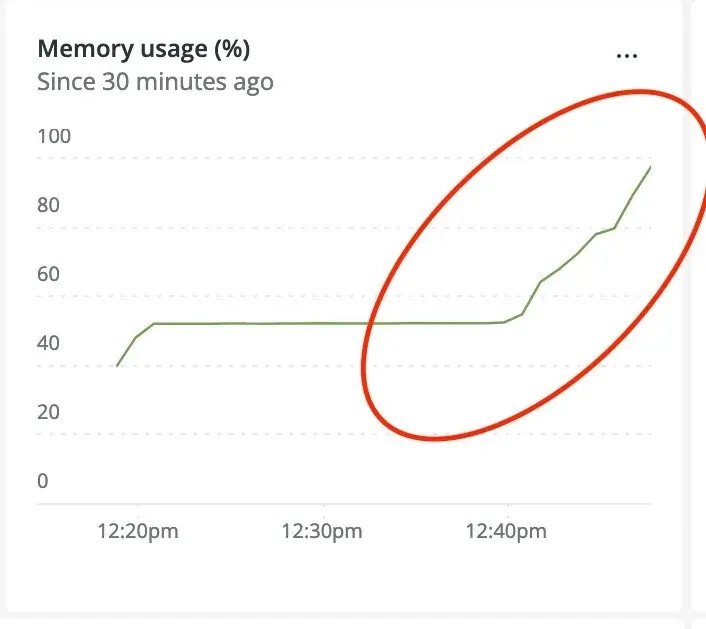
Once the root cause was identified, reproducing the problem was quite easy.
- Clear translations cache.
- Hit the relevant API.
- Rinse and repeat.
- Voila! See memory usage exploding.
Next Steps
The caching strategy was changed to rebuild after a configuration change rather than just clear the cache en masse. The final fix will be to refactor our translation framework to be smarter.
Conclusion
The eyes cannot see what the mind does not know.
This is a common quote that my medicine teachers used to often mention. The evidence is right there; making a diagnosis involves research and knowledge, and it’s easy to miss signs and clues if one is not methodical.